
Yes. White label AI reporting for agencies works as a retention product when the dashboard pulls data automatically from GA4, Google Ads, Meta, LinkedIn, GSC, and email, then layers AI-generated, plain-English insight summaries on top, all under your own brand. Agencies that ship this consistently report far lower client churn than agencies still assembling static PDF decks by hand.
Reporting Is Not a Cost Center. It’s the Product Clients Actually See
Most agencies treat reporting as overhead: something an account manager builds at 11pm on deadline night so the client stops asking where their budget went. That framing costs agencies clients. The monthly report is the one piece of work every client actually opens, good month or bad.
Focus Digital’s “Average Marketing Agency Churn: 2026 Report” found that delivery dissatisfaction is the top reason clients leave in 2026, cited by 48% of departing clients, up 14 percentage points year over year. Agencies rank it seventh on their own list of retention risks. That gap between what clients leave over and what agencies think they leave over is the whole argument for AI reporting as a retention product, not a nice-to-have.
The same report breaks out reporting quality directly. Among retainer and reporting-heavy agencies, clients who received AI-driven narrative reporting and stayed engaged with it churned at 9% annually. Clients who didn’t engage with their reporting churned at 31% annually — more than a 3x gap tied to one variable: whether the client understood, in plain language, what was happening with their account and why. A branded, AI-summarized dashboard doesn’t just save your team hours. It closes the exact gap that’s costing agencies clients right now.
What “AI Insight” Actually Means (Not a Chart Dump)
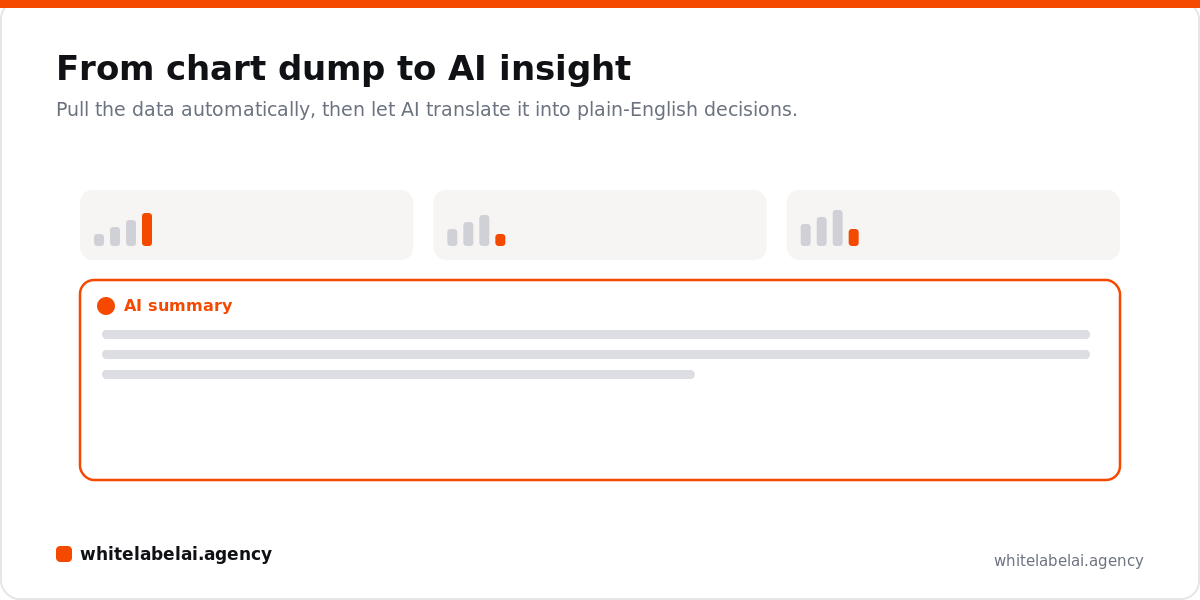
An AI insight is a written statement that tells a client what changed, how much it changed, why it probably changed, and what to do next. A chart dump is a set of numbers with no narrative attached. The difference is not cosmetic. It’s the entire value of the product.
Compare the two on the same data point:
Chart dump: “Meta CTR: 1.2% this week, down from 1.5% last week.”
AI insight: “Your Meta CTR fell 18% this week, driven almost entirely by the Retargeting – Cart Abandoners ad set losing reach as its audience saturated. The Lookalike 1% ad set is still performing above account average. Shifting $400/day from Retargeting into Lookalike would likely recover CTR within 5–7 days.”
The first requires the client to interpret the data themselves, which most clients can’t or won’t do. The second hands them a decision. That’s what agencies are actually charging for when they sell AI use cases like this one: not the dashboard, the judgment layered on top of it.
This is also where most “AI reporting” tools fall short of the marketing. Several platforms bolt a generic summary paragraph onto existing charts and call it AI. A summary that restates the chart in sentence form isn’t an insight; a real insight names a cause, a magnitude, and a next action. If a client still has to ask “so what should we do,” it isn’t doing its job.
What Goes Into the Dashboard: The Data Stack Clients Expect in 2026
A client dashboard worth charging for in 2026 pulls from every channel a client cares about, refreshed automatically, without your team touching a spreadsheet: GA4, Google Ads and Meta Ads, LinkedIn Ads (for B2B accounts), Google Search Console, and email platform data (Klaviyo, Mailchimp, ActiveCampaign, or similar).
Agencies running paid media already know this pain. Pulling Google Ads, Meta Ads, and LinkedIn Ads into one coherent view by hand is a big part of why account managers lose entire afternoons to reporting, a problem covered in more depth in our breakdown of AI PPC services for agencies. None of it should require a human copying numbers between platforms.
The dashboard needs three things to feel like a product rather than a utility: your logo and colors instead of the vendor’s, a custom domain or client portal so it feels owned rather than borrowed, and a written AI summary at the top of every report, not buried after five scrollable charts. Clients read the summary first. If it isn’t there, or isn’t specific, the rest of the dashboard doesn’t matter.
Pricing and Margin: What to Charge, What It Costs You
Reporting can be sold three ways: folded into the retainer as a retention lever, sold as a standalone add-on, or positioned as a premium “AI Insights” tier. Each has a different margin profile.
| Pricing model | What it costs you (tool) | What you charge the client | Monthly margin per client |
|---|---|---|---|
| Bundled into retainer (no new line item) | ~$20–$68/client/mo | No separate charge — sold as retention, not revenue | Retention value, protects existing MRR |
| Reporting as a paid add-on | ~$14–$20/client/mo | $99–$199/mo per client | $80–$180/client/mo |
| Premium “AI Insights” tier | ~$20–$35/client/mo | $199–$350/mo per client | $165–$320/client/mo |
| Custom white-label build (30+ clients) | Fixed build cost + ~$5–$15/client/mo hosting | $150–$400/mo per client, sold as a proprietary product | Highest margin past break-even, no per-seat SaaS fee |
Tool cost comes from current 2026 pricing on the platforms below. Client price reflects what agencies typically charge for a dedicated reporting product that includes AI-generated insight, not just automated charts, using the packaging logic covered in how agencies package AI services. According to Vendasta, a large majority of agencies already use white-label services in some form, according to Vendasta’s analysis of the agency market. Reporting is one of the easiest of those services to sell, because clients experience it directly, every month.
Build vs. White Label: The Decision Framework
The build-vs-buy decision on AI reporting comes down to three questions: client count, launch speed, and whether you want a generic tool with your logo on it or a genuinely proprietary product.
| Path | Time to launch | Upfront cost | Who maintains it | Best for |
|---|---|---|---|---|
| Build in-house (custom BI + LLM API) | 3–6 months | $15,000–$60,000+ in dev time | Your team, indefinitely | Agencies with in-house engineering and 50+ clients to spread cost across |
| Off-the-shelf white-label SaaS | 1–2 weeks | $0 upfront, per-client or per-dashboard fee | The vendor | Agencies under ~40 clients who want to ship this quarter |
| White-label build partner (custom, under your brand) | 3–6 weeks | Fixed project fee, no per-seat tax at scale | The partner, under NDA | Agencies who want a dashboard that looks and feels like their own product |
Most agencies default to the middle option because it’s fastest, a reasonable starting point. It stops being the right call once you’re paying per-client SaaS fees on 60, 80, 100 clients and the math favors a fixed-cost build. It’s the same tradeoff covered in selling AI content production to clients: rent the capability while proving the offer, then decide whether owning it outright makes sense once volume justifies it.
Who’s Actually Selling This: AgencyAnalytics, DashThis, Whatagraph, and TapClicks
Pricing across the major white-label reporting platforms moved meaningfully in 2026, and older cost comparisons online are now out of date on every one of these tools.
| Platform | Current pricing (verified 2026) | AI insight feature | Best fit |
|---|---|---|---|
| AgencyAnalytics | Core plan: $20/client/month, billed annually, unlimited sources, reports, and users. Enterprise: custom, starts at 25 clients. | Ask AI (natural-language chat over client data) plus an AI Summary widget on every report | Agencies who want simple, predictable per-client pricing |
| DashThis | Individual $49/mo ($42/mo billed yearly), Professional $149/mo, Business $289/mo, Standard $449/mo, priced by dashboards and connected sources under its 2026 pricing model | AI Insights Free (4 preset insights: Summary, Wins, Issues, Opportunities) included on every plan; AI Insights Pro adds chat mode and client context for $19/mo ($15/mo billed yearly) | Agencies who think in dashboards per client rather than a flat per-seat fee |
| Whatagraph | Max plan from roughly $812/month billed annually (50+ source credits); Prime is custom, quote-based | Whatagraph IQ: automated report creation, plain-language performance summaries, and a chat interface, included on every plan | Larger agencies managing many connected accounts per client |
| TapClicks | No public pricing — quote-only, based on modules and client volume | SmartStory, launched February 2026, turns live campaign data into stakeholder-ready decks with AI-generated narrative and visuals, backed by 13 dedicated AI Insights Agents | Agencies that need boardroom-ready presentations, not just a dashboard URL |
Two corrections if you’ve seen older pricing floating around. AgencyAnalytics has moved off its previous $10-15/client entry point to a flat $20/client/month Core plan. Whatagraph repriced sharply upmarket, replacing its old sub-$200 entry tier with a Max plan starting near $812/month. TapClicks has never published pricing; treat any number quoted online as a third-party estimate, not a confirmed rate. All four now ship some form of AI-generated narrative alongside the dashboard: automated charts are table stakes, and the AI summary is what agencies are actually charging for.
The Vanity Dashboard Trap
A vanity dashboard is full of metrics that look impressive and change nothing about what the client does next: impressions, reach, follower counts, raw session totals, “engagement” numbers with no dollar figure attached. They fill a dashboard. They don’t retain a client.
The test for whether a metric belongs on a client-facing dashboard: can the AI summary attached to it recommend a specific action? “Impressions were up 12% this month” doesn’t pass. “Impressions were up 12%, but qualified leads from paid search dropped 9%, meaning the extra reach isn’t reaching the right audience” does. Same underlying data, restructured around a decision instead of a vanity number.
This trap catches agencies most often when they buy an off-the-shelf tool and never customize the default widgets. Every platform above ships with a template full of generic engagement metrics. Retaining clients means deleting most of that template and keeping only what ties directly to the client’s stated goal: leads, revenue, or booked calls.
Frequently Asked Questions
What is white label AI reporting for agencies?
White label AI reporting is a branded client dashboard that automatically pulls data from platforms like GA4, Google Ads, Meta, LinkedIn, GSC, and email, then adds AI-generated summaries explaining what changed and why. It’s sold under the agency’s own brand, not the vendor’s.
How much does an AI client dashboard cost per client?
Current 2026 pricing runs roughly $14–$68 per client per month, with AgencyAnalytics at $20/client/month and DashThis around $14/client/month on its Professional plan. Agencies typically charge clients $99–$350/month for the finished product, depending on whether it’s bundled into the retainer or sold as a standalone tier.
Does AI reporting actually reduce client churn?
Yes, according to Focus Digital’s 2026 churn research, which found agencies delivering AI-driven narrative reporting to actively engaged clients saw 9% annual churn, compared to 31% annual churn among clients who weren’t engaging with their reports. Delivery dissatisfaction, not campaign performance, was the top-cited reason clients left in 2026.
Should I build my own AI reporting dashboard or use a white-label tool?
Use an off-the-shelf white-label tool if you’re under roughly 40 clients or want to launch this quarter. Consider a custom build, in-house or through a white-label partner, once per-client SaaS fees on a larger roster outweigh a fixed development cost.
What data sources should an agency dashboard pull from?
At minimum: GA4, Google Ads, Meta Ads, Google Search Console, and email platform data, plus LinkedIn Ads for B2B accounts. Every source should refresh automatically; manually exporting data from any platform means the dashboard isn’t finished yet.
Is TapClicks or AgencyAnalytics better for white label AI reporting?
AgencyAnalytics fits agencies that want predictable, published per-client pricing starting at $20/client/month. TapClicks doesn’t publish pricing and leans toward AI-generated stakeholder presentations through SmartStory, making it a better fit for agencies that need boardroom-ready decks rather than a self-serve dashboard link.
How do I price an AI reporting service for clients?
Most agencies pick one of three models: fold it into the existing retainer as a retention feature, charge $99–$199/month as a standalone add-on, or sell a premium “AI Insights” tier at $199–$350/month above the base retainer. The right choice depends on whether reporting is protecting existing revenue or generating new revenue.
Turn Your Reporting Into a Retention Product
A branded AI dashboard is one of the fastest AI service lines an agency can stand up, and one of the few clients interact with every month, whether or not you’re pitching them on anything new. Get the data stack right, get the AI summary right, and cut everything that doesn’t drive a decision.
If you’d rather not build or manage the reporting infrastructure yourself, that’s exactly what we do behind the scenes for our agency partners, under their brand, with client relationships staying theirs. Book a partner call to see what a white-label AI reporting product would look like running under your name.